How Innovative Are States In United States?

United States has been in the forefront of innovations for the past few decades. However, in the  recent years, many other countries have caught up the innovation race and doing great.
Within United States some states are very innovative compared to other states. When we had set out to find how innovative are each state in US vis-a-vis rest of the countries in the world, we had very interesting findings.
“One way to measure how innovative a country or state is to measure the number of Patents granted.”
Number of countries are improving their IP laws and strengthening them, as they understand Patents and IP protection as a key in innovation and development

Patents give exclusive rights from making, selling or importing to an invention or a new idea (actually an right to exclude others). A patent grant in a country indicates a possible commercialization of an innovation or a new technology in that country. Hence, one way to measure innovation index of a geography is through measuring the intellectual property protection in the form of patents.
Two decades ago, many countries including Japan,  China, and Korea were far behind the United States in total number of patent grants. The total number of granted patents of these countries were less than the resident patent grants of United States (Resident patent grants are nothing but the granted patents hold by the Residents of United States at USPTO)
However, in recent years China, Japan and Korea have overtaken United States when we compare their total patent grants with United States’ resident patent grants.
How innovative are States in United States
How do American states compare with other countries in terms of patent grants and hence innovation? Taking the nearest equivalent country from 2014 patent grants data and comparing the patenting levels reveals facts and few surprises.
We used information of U.S. States resident patent grants data from the USPTO’s PTMT report and compared them against the total number of patent grants of each country from the World Intellectual Property Indicators report released by World Intellectual Property Organization (WIPO). As a result we get a map of the U.S. with each state renamed as the country that comes close with the number of patent grants.
 West is doing great
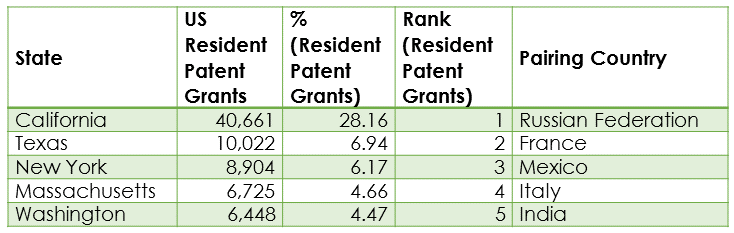
Right away you’ll notice the states on the west are doing better and California is standing out in particular. Not surprisingly, with the existence of Silicon Valley & more powerful economy, California is ranked 1st in number of patent grants within US. The golden state California with 40,661 patent grants almost matched the number of patent grants of “RUSSIAN FEDERATION” which has around 33,950 patent grants during 2014. Besides being number one, California almost contributes around 28% to the total number of resident patent grants of U.S.
Evergreen state Washington, another one from west – also ranked 5th in number of patent grants (6,448) – is on par with INDIA’s total number of patent grants (6,153).
Interesting to note that another state in the west the Pacific’s wonderland – Oregon (2,391 Patent grants) ranked 17th in number of resident patent grants can be compared with world’s tallest twin tower country MALAYSIA in number of patent grants (2,705).
It is evident from the map that the states in the west – i.e., California, Washington and Oregon perform well in innovation & patenting and they share almost 1/3rd of total number of resident patent grants of United States.
The East
“14 states on the east and their 40,000 resident patent grant equals the California’s.”
We can see that the states in the east are also equally performing well collectively in terms of resident patent grants and the 14 states collectively contribute around 28% to the total number of resident patent grants of U.S.
We can say east (with 14 states collectively) as second best region for innovation and patenting with little exceptions like Delaware, Rhodes Island and Maine.
Texas, with 10,022 patent grants, ranked 2 in total number of resident patent grants is almost as innovative as France.
Top 5 States with US resident patent grants
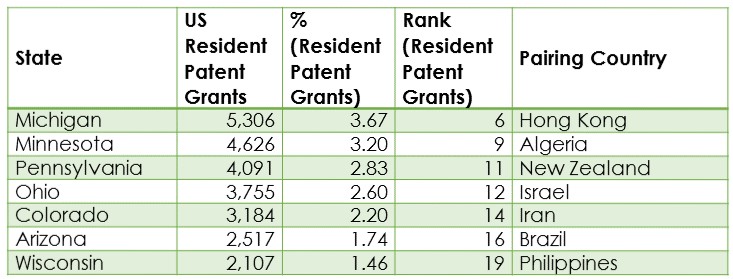
Other states which contribute significantly to the total resident Patent grants are Michigan, Minnesota, Pennsylvania, Ohio, Colorado, Arizona, and Wisconsin.
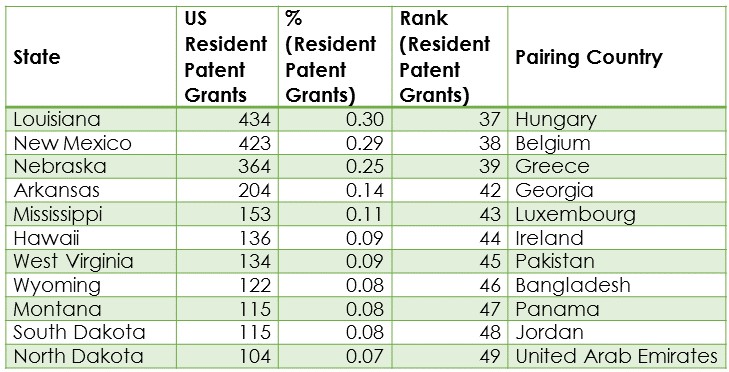
States Louisiana, New Mexico, Nebraska, Arkansas, Mississippi, Hawaii, West Virginia, Wyoming, Montana, South Dakota and North Dakota were very low in innovation and ranked low in number of resident Patent grants.
 Almost 60% of the total resident patent filings has been contributed by the 17 states primarily in West and East. The remaining 40% of the Patent grants were contributed by rest of the 33 states.
Are large business organizations reasons for the skew?
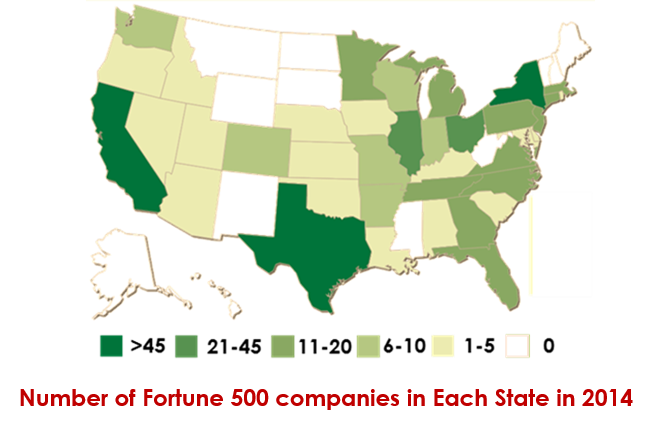
We found that the states, with the most Fortune 500 companies, California (54), Texas (52) and New York (47) were completely dominating every other state in number of patent grants. In fact, these three states house nearly one third of America’s top companies. We discussed enough about California.
Top 10 States with most Fortune 500 companies
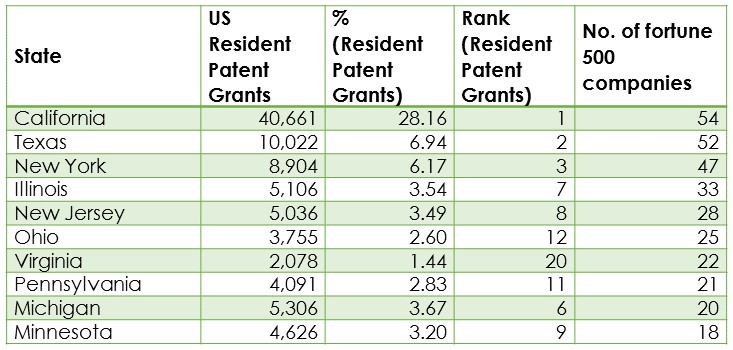
But what’s particularly impressive is the ‘Lone Star in South’ Texas, which, with 10,022 patent grants, is ranked 2 in total number of resident patent grants is almost matching with “France” (11,889 patent grants) which is the highly urbanized country of the world.
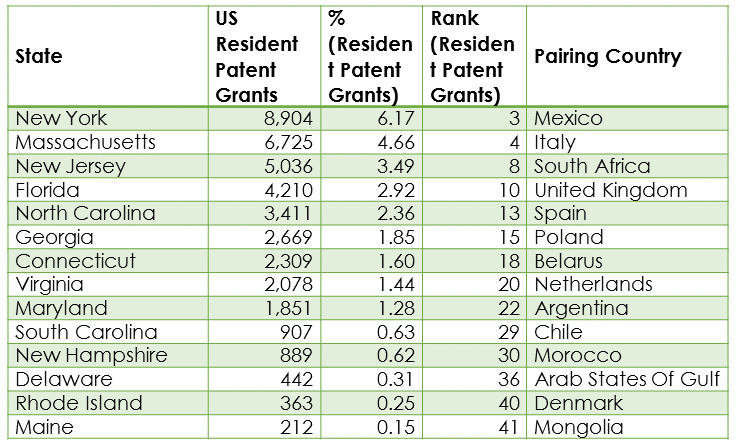
Also, as one of the major contributor to innovation & patent grants, New York with a numerous fortune 500 companies Ranked 3rd with 8,904 resident patent grants. The innovation level of New York is comparable with that of Mexico as a whole which has around 9,819 patent grants.
Egg or Chicken? Economy or Innovation ?
Gross Domestic product (GDP) is typically the most comprehensive measure of national economic activity. In United States, economic activity is also measured through Gross state product (GSP) of each state.
Economy has an impact on innovation and patenting when it is used as an input (e.g. investment) or derived as an output (e.g. sale of products).

States with comparatively high Gross state product (GSP) would have invested more in innovation and hence higher level of patenting. On the other hand, states with comparatively low GSP would have not invested as much in innovation.
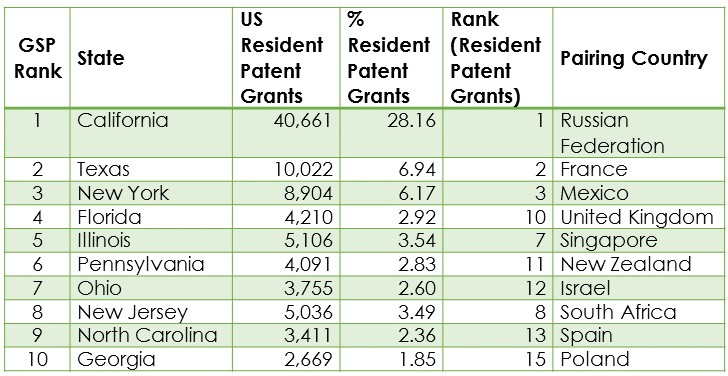
The Top 10 States with high GSP fell within top 20 ranks of number of resident patent grants. With no surprise again, California, Texas, New York with their top 3 position in GSP have topped in resident patent grants as well.
States with Highest GSP’s and their level of Patenting
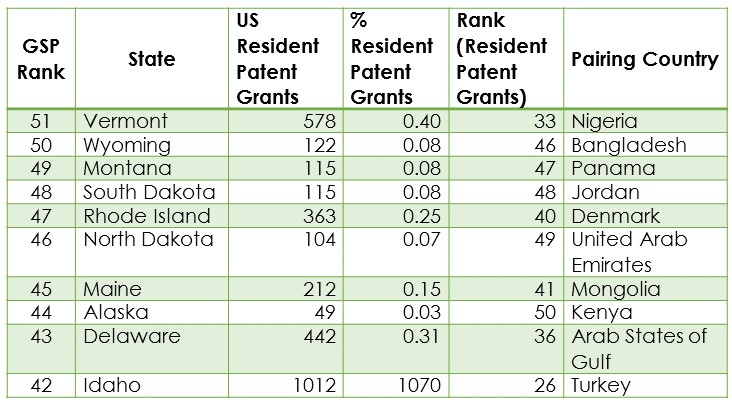
States with Lowest GSP’s and their level of Patenting
So from an economic point of view (GSP), States with high GSP and economic activity have more innovation and patent grants. The Top 10 economically powerful states of US shares almost 60% total resident patent grants of US.
States with low GSP and patenting levels should turn their focus towards innovation to improve the economy further.
Competing with the developing countries
From the map, we can notice that developing countries like INDIA (6,153), SOUTH AFRICA (5,065) and ALGERIA (5,372) have innovation that is equally competing with that of Washington (6,448), New Jersey (5,036) and Minnesota (4,626) respectively.

Will India, South Africa and Algeria improve their innovation exponentially and become competitors for the top 3 states of US – California, Texas and New York and if yes, how fast?
Take away
This study reveals, with in United States, some states are comparatively more innovative than other states. The difference in Economy, population and environmental factors are major reasons behind differences in level of innovation. For example, California, Texas and New York are in the Top of the list in Economy, innovation as well as in resident patent grants. Alaska, North Dakota, South Dakota, Wyoming, Montana and Hawaii are weak performers in innovation and patenting.
Few countries such as China, Japan and Korea have already overtaken United States’ innovation and patenting. Developing countries like India, South Africa and Algeria can be on the watch list.
One more interesting point to note that developed countries such as Denmark and United Arab Emirates are still in weaker position in innovation and patenting.
Though United States have been witnessing continuous growth in their innovation and patenting, at US Patent office, more than 50% of the patents were granted to non-resident applicants. Two decades ago United States was in top position in innovation and patenting. Around 60% of the Total resident patent filings at US Patent office were contributed by only 19 states of America. United States still has a chance to acquire the first position again if the other 31 states perform well in economy, innovation and patenting along with the rest of the 19 good performing states.
Complete list of US States and their level of Innovation
Number of resident patent grants of United States and their pairing country which has equivalent or similar patenting levels (all data relate to year 2014)
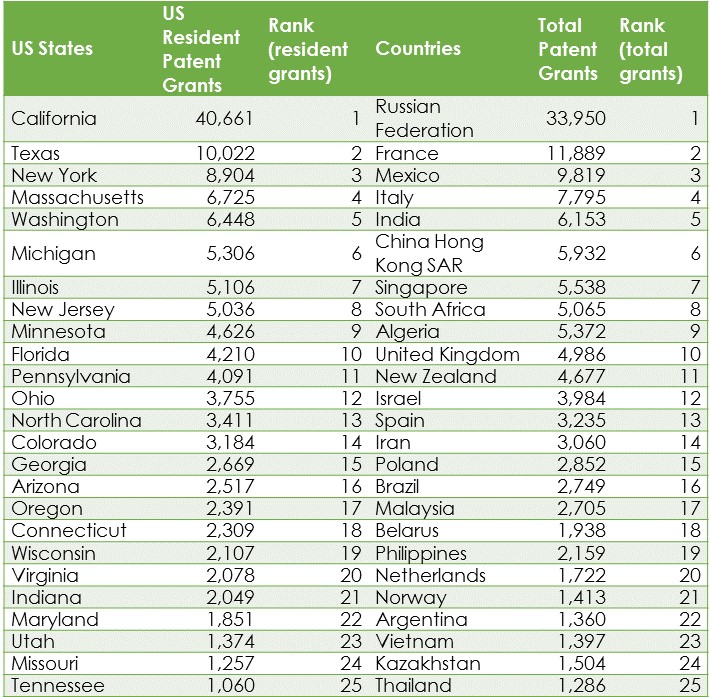
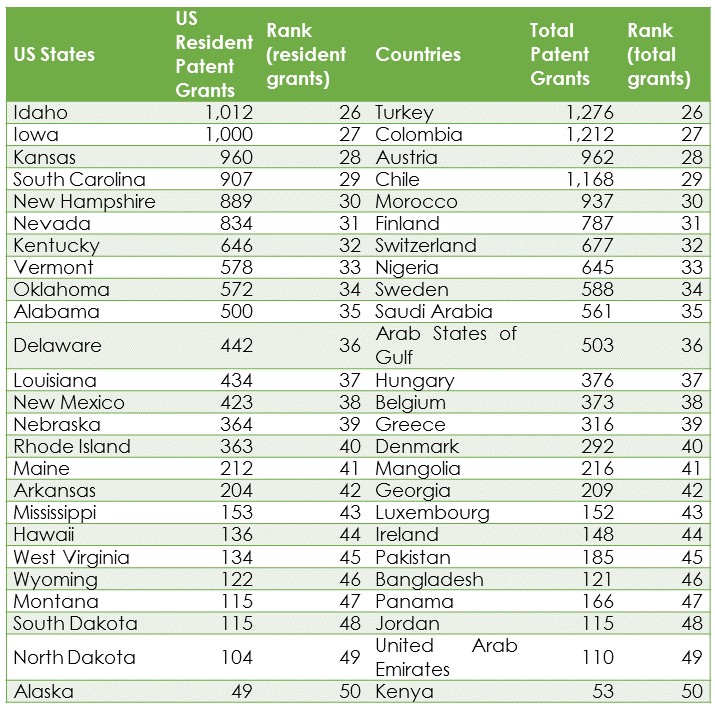
Notes:
•All Data including Patent data used in the analysis relate to year 2014
•Patent grants of China, Japan and Korea were not compared in this map against States of America, as they were significantly higher.
•For analysis and comparison purposes, the number of patent grants were rounded or approximated.
If you have any queries and comments, please reply to caro@dexpatent.com
To know more about us, Please visit us www.dexpatent.com


0 Comments